1. Overall trending is positive over the period of 10 years. At current point of time, I would say that it is trading close to the average trendline near 50%.

2. Look at the chart plotted for Price vs EPS vs NAV. Stock price got extremely inflated after 2013. Over the last 3 years from 2014 onwards, EPS has been on the decline.

3. For measurement of EPS, i like to compare to historical P/E ratio. The average P/E over the last 10 years should be around 13. If i adjust it to post 2008, average P/E should fall near 15-16. At current price, I would only be interested if the price can fall back to 0.6x region to justify a fair value.

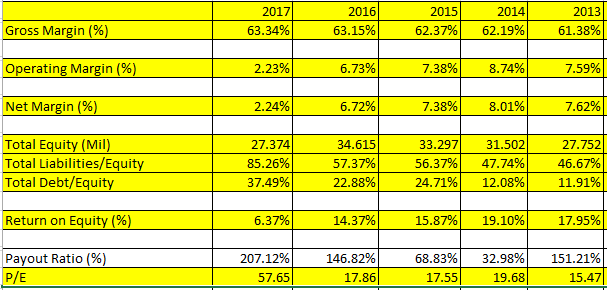
4. A look at the fundamental numbers of the business. I don't like the fact that margins are dropping over the past 5 years while stock price has not. Debt level has gone up as well while ROE/profit have not. While it has been paying out dividends consistently, I would question whether the level of dividend payout will be sustainable in the future, seeing that the payout ratio has gone up higher than 100% in the last 2 years.
5. I will only be interested if the price fallen to $0.6x region. While OCK will be in my watchlist, I will not be vested in it for the time being.
No comments:
Post a Comment