Saturday 17 June 2017

A value in Guocoland?

Guocoland has been in my watchlist for quite some time. Many of you might not know but Singapore tallest building - Tanjong Pagar Centre (also known as Guoco Tower) is owned by Guocoland. It comprises of 5 key components - office, hotel, retail and F&B, residences and an urban park.

What attracts me to this counter is purely the huge discount to NAV. At almost 40% off using current price of $1.9 to NAV of $2.95. According to Peter Lynch 6 categories of stocks - this category is known as "Asset Play". Since valuation of property counters is usually measured by NAV. 

Looking at the chart of NAV vs stock price. I like what I'm seeing here, NAV is growing while stock price is accumulating. This gives huge potential to the counter. 


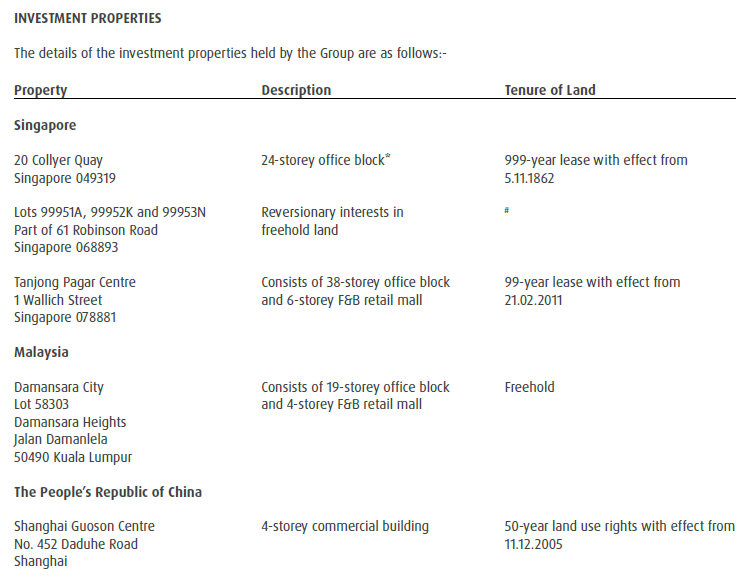
On another note, I like the fact that TPC (which completed in Oct 16) is providing the property developer counter with rental income, which goes in line with management "strategic goals of growing recurring income through investment properties to sustain future growth". Although the company huge revenue is still from sales of development properties, I would be expecting increasing opportunities by GL to invest more in investment properties to increase their recurring income.


On a last note, the counter has been giving out dividends quite consistently. Although the yield is about 2-3%. What's better than getting recurring income while waiting for the price to unlock. That might or might not happen in near future, patience is required.


Tuesday 13 June 2017

A Look at Old Chang Kee

The recent big drop in Old Chang Kee Q4 results had got me interested in looking at the financial numbers behind this brand that almost all locals are familiar with. Let's look at the price movement.

1. Overall trending is positive over the period of 10 years. At current point of time, I would say that it is trading close to the average trendline near 50%.


2. Look at the chart plotted for Price vs EPS vs NAV. Stock price got extremely inflated after 2013. Over the last 3 years from 2014 onwards, EPS has been on the decline. 


3. For measurement of EPS, i like to compare to historical P/E ratio. The average P/E over the last 10 years should be around 13. If i adjust it to post 2008, average P/E should fall near 15-16. At current price, I would only be interested if the price can fall back to 0.6x region to justify a fair value.


4. A look at the fundamental numbers of the business. I don't like the fact that margins are dropping over the past 5 years while stock price has not. Debt level has gone up as well while ROE/profit have not. While it has been paying out dividends consistently, I would question whether the level of dividend payout will be sustainable in the future, seeing that the payout ratio has gone up higher than 100% in the last 2 years.


5. I will only be interested if the price fallen to $0.6x region. While OCK will be in my watchlist, I will not be vested in it for the time being.

Monday 12 June 2017

First step

Second Revenue is created to log down my investment journey and garner like minded people to share, comment and spread investment knowledge to people with similar passion. I believe in the route to financial freedom, a lone battle will never be more effective than a community working towards the same goal.

As Buffett famously quote: "Price is what you pay, value is what you get".

That sums up pretty much my philosophy of investment - which is on value and income investing; ultimately creating a second stream of revenue that will lead to our path to financial freedom.